
Market Overview
After a strong rally to start the year, gold and silver prices have pulled back over the past week. Traders and investors are now asking: Is this a short-term correction or the start of a deeper decline?
While many attribute the recent dip to rising bond yields, a stronger U.S. dollar, and firmer risk appetite, deeper market analysis suggests other factors could be driving the retracement.
📊 Key Takeaways:
✔️ Gold consolidates above $3,000, maintaining its bullish structure.
✔️ Silver pullback forms a falling wedge, signaling potential upside.
✔️ Momentum indicators are mixed, but overall bullish bias remains intact.
✔️ Technical signals suggest a breakout could be near.
With quarter-end approaching and a quiet economic calendar, price action is expected to be a crucial guide for traders looking to capitalize on market movements.
🟡 Gold Holds Firm Above $3,000: Is This a Buy Signal?
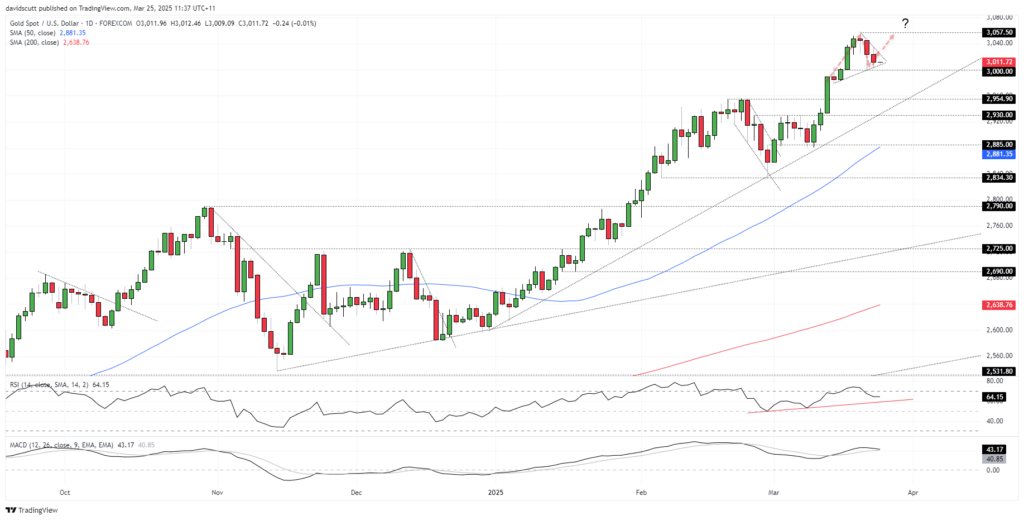
Despite the recent dip, gold remains in a strong uptrend, holding above the key $3,000 level and maintaining support at its 50-day and 200-day moving averages.
🔹 Technical Outlook on Gold (XAU/USD)
- Gold price pattern: The recent consolidation has formed a triangle pattern, suggesting a breakout is imminent.
- Momentum indicators: While MACD is approaching the signal line from above, RSI remains in bullish territory.
- Key support levels:
- 🟢 $3,000 – Critical psychological and technical support.
- 🟢 $2,954.90 – Next downside target if weakness persists.
- Key resistance levels:
- 🔴 Triangle resistance breakout could push gold back toward its record high of $3,057.50.
📢 Bullish Bias: The strong technical structure suggests that buying dips remains the preferred strategy, especially if price holds above key support zones.
⚪ Silver’s Pullback: A Setup for the Next Rally?
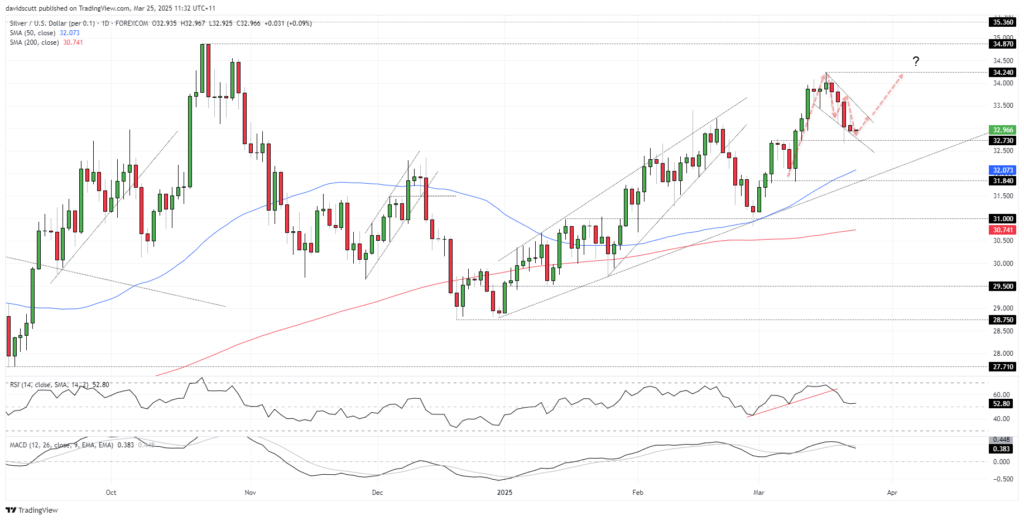
After breaking above $33 earlier this month, silver’s rally stalled near $34, temporarily delaying a potential run toward October’s highs. However, the recent pullback is forming a bullish falling wedge, a pattern that often precedes an upside breakout.
🔹 Technical Outlook on Silver (XAG/USD)
- Silver price pattern: The formation of a falling wedge suggests traders should be on alert for a bullish breakout.
- Momentum indicators:
- 📉 RSI & MACD show short-term bearish signals, favoring near-term downside.
- 📈 Silver is still trading above its 50-day & 200-day moving averages, keeping the long-term uptrend intact.
- Key support levels:
- 🟢 $32.73 – First support zone.
- 🟢 $31.84 – Stronger support if a deeper pullback occurs.
- Key resistance levels:
- 🔴 $33.50 & $34 – Immediate hurdles for further upside.
- 🔴 $34.24 (March 18 high) – A break here could open the door to October 2024 highs.
📢 Bullish Bias: Despite near-term weakness, silver remains a buy-the-dip opportunity, especially if price breaks above falling wedge resistance.
📊 What’s Next for Gold & Silver?
💡 Gold & silver remain in strong uptrends, and the recent pullbacks could be setting up fresh buying opportunities.
🚀 What to watch for:
✔️ Gold holding above $3,000 – Signals strength for further upside.
✔️ Silver breaking out of falling wedge – Could trigger a rally back toward $34+.
✔️ U.S. dollar & bond yields – Key external factors influencing price action.
🔍 Final Thoughts: Buy-the-Dip or Stay Cautious?
✅ Gold & silver remain bullish overall, with technical signals favoring a continuation of the uptrend.
✅ Short-term pullbacks offer traders an opportunity to enter at better prices.
✅ Traders should watch key support & resistance zones closely for potential breakout setups.
📢 Do you see gold and silver continuing their rally, or is a deeper correction coming? Drop your thoughts in the comments! 💬
📌 Disclaimer: This article is for informational purposes only and does not constitute financial advice. Always conduct your own research before making investment decisions.